VueJS is one of the 3 most used modern web development framework together with React and Angular.
Despite that the latter maintained respectively by the tech giants Facebook and Google, Vue seems highly attractive to many experienced web developers for its design, its flexibility and ease of development. That makes it very appealing for a newbie like me who doesn't know where to start ;)
This tutorial is about visualizing data in a web app built with Vue.JS. It is the codelab version of a useful presentation by Callum Macrae, "Data visualisation with Vue.JS".
What you will learn
In this tutorial you will learn to do the following:
- write Hello World with Vue.js
- draw a rectangle as vector graphics (building SVG objects)
- define the properties of this SVG object in Vue.js
- use Vue transforms to replicate multiple rectangles
- inject some javascript to build a bar chart with Vue.js and your simple SVG.
- introduce methods in Vue.js to keep the logic out of the HTML as much as possible.
Prerequisites
With this codepen using only HTML & JS piece of code:
<!-- development version, includes helpful console warnings -->
<script src="https://cdn.jsdelivr.net/npm/vue/dist/vue.js"></script>

<div id="app">
  {{ message }}
</div>
var app = new Vue({
  el: '#app',
  data: {
    message: 'Hello Vue!'
  }
})
you should see:
Hello Vue!
<svg xmlns="http://www.w3.org/2000/svg"
      width="200" height="200">

   <rect width="200" height="100"
        x="10" y="10"
        fill="#f0b375">
  </rect>
</svg>
Simply test it live: https://codepen.io/patechoc/pen/PXyerE.
Let's get back the width and height from Javascript with Vue:
new Vue({
  el: '#chart',
  data: {
    width: 200,
    height: 100,
    x: 10,
    y: 10
  }
});
  <svg xmlns="http://www.w3.org/2000/svg"
        width="200" height="200" id="chart">

     <rect :width="width" :height="height"
          :x="x" :y="y"
          fill="#f0b375">
    </rect>

  </svg>
You should get the exact same rectangle, but now generated from values coming from Vue.
Start building a bar chart now!
We introduce the <g> element in SVG, which is a bit like the <div> in HTML. It doesn't do anything by itself, but you use it to group things together, here a rectangle and some text.
<svg xmlns="http://www.w3.org/2000/svg" width="500" height="300">
  <g transform="translate(0,0)">
    <rect width="60" height="19" fill="#f0b375"></rect>
    <text x="60" y="9.5" dy=".35em">60</text>
  </g>
  <g transform="translate(0,20)">
    <rect width="80" height="19" fill="#f0b375"></rect>
    <text x="80" y="9.5" dy=".35em">80</text>
  </g>
  <g transform="translate(0,40)">
    <rect width="150" height="19" fill="#f0b375"></rect>
    <text x="150" y="9.5" dy=".35em">150</text>
  </g>
  <g transform="translate(0,60)">
    <rect width="160" height="19" fill="#f0b375"></rect>
    <text x="160" y="9.5" dy=".35em">160</text>
  </g>
  <g transform="translate(0,80)">
    <rect width="230" height="19" fill="#f0b375"></rect>
    <text x="230" y="9.5" dy=".35em">230</text>
  </g>
  <g transform="translate(0,100)">
    <rect width="420" height="19" fill="#f0b375"></rect>
    <text x="420" y="9.5" dy=".35em">420</text>
  </g>
</svg>
Clearly a For loop would be more elegant here and reduce the size of the HTML template.
new Vue({
  el: '#chart',
  data: {
    chartData: [60, 80, 150, 160, 230, 420],
  },
});
<svg xmlns="http://www.w3.org/2000/svg" width="500" height="300" id="chart">
  <g
    v-for="(value, i) in chartData"
    :transform="`translate(0, ${i * 30})`">
    <rect width=200 height="19" fill="#f0b375"></rect>
    <text x="200" y="9.5" dy=".35em">{{ value }}</text>
  </g>
</svg>
This will simply translate the same rectangle (200x19) by 30 pixels to make this:
And to get a bar chart, we just need to pass the value to the width of each rectangle.
The javascript part doesn't change.
new Vue({
  el: '#chart',
  data: {
    chartData: [60, 80, 150, 160, 230, 420],
  },
});
But to generate the length of these bars, we will include some javascript and do a little bit of maths. Thos codepen will show it live.
<svg xmlns="http://www.w3.org/2000/svg" width="500" height="300" id="chart">
  <g
    v-for="(value, i) in chartData"
    :transform="`translate(0, ${i * 30})`">
    <rect :width="value" height="19" fill="#f0b375"></rect>
    <text :x="value" :dx="-Math.ceil(Math.log10(value))*10" y="9.5" dy=".35em">{{ value }}</text>
  </g>
</svg>
The problem with that is that it moves maybe too much of the logic to the HTML template. We would rather compute everything in the Javascript.
Here we move the calculation of the length of the bar and of the position of the text from the HTML template back to javascript with the Vue.js methods barWidth(value) and textPosition(value). This doesn't change the output.
new Vue({
  el: '#chart',
  data: {
    chartData: [60, 80, 150, 160, 230, 420],
  },
  methods: {
    barWidth(value){
      return value*500/420;
    },
    textPosition(value){
      return -Math.ceil(Math.log10(value))*10;
    },
  },
});
<svg xmlns="http://www.w3.org/2000/svg" width="500" height="300" id="chart">
  <g
    v-for="(value, i) in chartData"
    :transform="`translate(0, ${i * 30})`">
    <rect :width="barWidth(value)" height="19" fill="#f0b375"></rect>
    <text :x="barWidth(value)" :dx="textPosition(value)" y="9.5" dy=".35em">{{ value }}</text>
  </g>
</svg>
Notice that now, we also scale the bars relatively to the highest value we have (here 420). The length of the highest bar should always be at the max of your SVG width (e.g. 500), and the others be scaled relatively to that one (i.e. multiplied by a factor 500/420).
We hard-coded the scaling factor 500/420 in the last example. This is not so elegant ;)
Hopefully for us, Vue.js also includes what is called computed properties.
We don't have to change the HTML template (a little bit here to update the SVG length and width),
<svg xmlns="http://www.w3.org/2000/svg" :width="chartWidth" :height="chartLength" id="chart">
  <g
    v-for="(value, i) in chartData"
    :transform="`translate(0, ${i * 30})`">
    <rect :width="barWidth(value)" height="19" fill="#f0b375"></rect>
    <text :x="barWidth(value)" :dx="textPosition(value)" y="9.5" dy=".35em">{{ value }}</text>
  </g>
</svg>
and here is how we use the computed properties in javascript:
new Vue({
  el: '#chart',
  data: {
    chartWidth: 600,
    chartLength: 300,
    chartData: [60, 80, 150, 160, 230, 420],
  },
  methods: {
    barWidth(value){
      return value * this.chartWidth / this.dataMax;
    },
    textPosition(value){
      return -Math.ceil(Math.log10(value))*10;
    },
  },
  computed: {
    dataMax() {
      return Math.max(...this.chartData);
    },
  },
});
See it working live here and play with the values in the JS part.
Computed properties are like half-way between the data and the methods:
- we access them as if they were properties of the data object,
- but they are executed as functions.
Similar functionalities
Let's compare Vue.js methods and computed properties:
<div id="chart">
  <p>{{ someMethod() }}</p>
  <p>{{ someComputed }}</p>
</div>
new Vue({
  el: '#chart',
  methods: {
    someMethod() {
      return "method response";
    },
  },
  computed: {
    someComputed() {
      return "computed response";
    },
  },
});
Test it live here!
Different behaviour
Even though they look very similar, they behave very differently.
We can desmonstrate it by calling them multiple times and adding some logs to the console:
<div id="chart">
  <p>{{ someMethod() }}</p>
  <p>{{ someMethod() }}</p>
  <p>{{ someMethod() }}</p>
  <p>{{ someComputed }}</p>
  <p>{{ someComputed }}</p>
  <p>{{ someComputed }}</p>
</div>
new Vue({
  el: '#chart',
  methods: {
    someMethod() {
      console.log("method called");
      return "method response";
    },
  },
  computed: {
    someComputed() {
      console.log("computed property called");
      return "computed response";
    },
  },
});
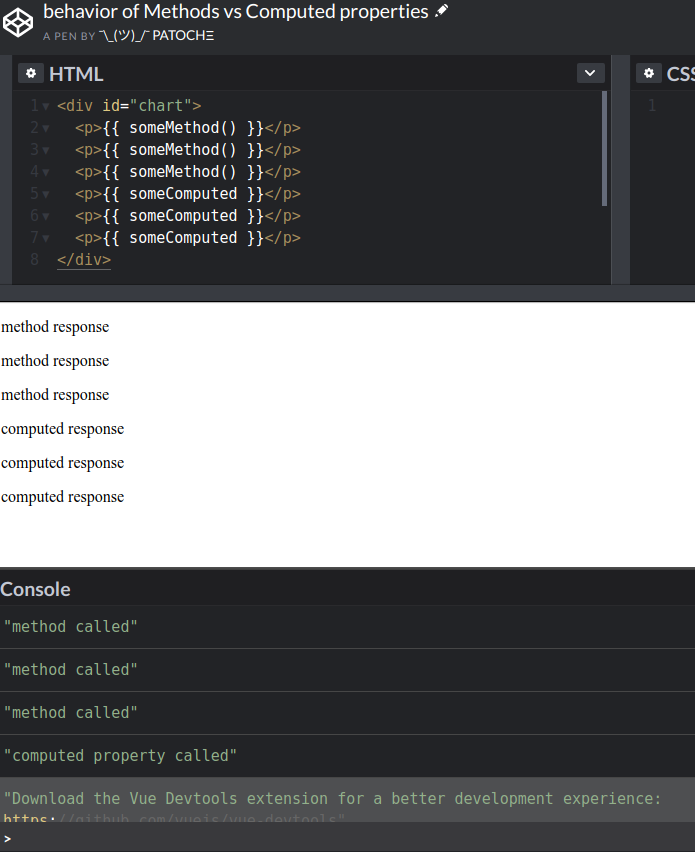
The output looks like each has been called 3 times, but the console clearly shows that only the method has really been processed/evaluated 3 times, while the value of computed property seems like cached and not evaluated more than once!
See it by yourself in this code snippet!
Events use the
v-on directive.
(More on directives...)
- we pass
clicktov-onas an argument. - when we click anywhere on the SVG chart, we trigger the
handleClickmethod. - In this example the
handleClickmethod just randomize the input data.
<svg id="chart" :width="chartWidth" :height="chartHeight" v-on:click="handleClick">
  <g
     v-for="(value, i) in chartData"
     :transform="`translate(0, ${i * (barHeight + 10)})`">
    <rect :height="barHeight" :width="barWidth(value)"></rect>
    <text :y="barHeight / 2" :x="barWidth(value) - 10">{{ value }}</text>
  </g>
</svg>

<!-- intro next part + hardcode dataMax -->
const randomData = () => new Array(6).fill('').map(() => 1 + Math.floor(Math.random() * 20));

new Vue({
  el: '#chart',
  data: {
    chartWidth: 900,
    chartHeight: window.innerHeight - 10,
    chartData: [60, 80, 150, 160, 230, 420],
  },
  methods: {
    barWidth(value){
      return value * this.chartWidth / this.dataMax;
    },
    textPosition(value){
      return -Math.ceil(Math.log10(value))*10;
    },
    handleClick() {
      this.chartData = randomData();
    },
  },
  computed: {
    barHeight() {
      return this.chartHeight / this.chartData.length - 10;
    },
    dataMax() {
      return Math.max(...this.chartData);
    },
  },
});
Test it by clicking on the SVG in this live snippet!
- https://vuejs.org/v2/guide/
- Screencasts mirroring the official Vue.js guide
- Example: SVG transforms (translation, rotation, skew, scale, matrix, 3D rendering) https://codepen.io/AmeliaBR/pen/aDhrs/
- Example: interactions with widgets using HTML, SCSS (CSS) and Babel (JS) https://codepen.io/airen/pen/LerXYd
- Example using Pug (HTML), Less (CSS) and Babel (JS): https://codepen.io/sirlancelot/pen/NNGYEP
- Example using Pug (HTML), Less (CSS) and Babel (JS): https://codepen.io/sirlancelot/pen/ZWEWbQ
- Many examples with demo: https://vuejsexamples.com/font-awesome-component-for-vue-js-using-inline-svg/
- Art with SVG: (Mathieu Robert Ortis style) https://codepen.io/igstudio/pen/ZQxrBw
- Art with SVG: (Mathieu Robert Ortis style) The eye https://codepen.io/ge1doot/pen/qLyZvQ
- Maps [TO BE ADAPTED TO Vue.js]: https://gist.github.com/auremoser/da1b8fe8de23fe6365923b1a4d8f7b7d